Tweezer Bottom
Two candles with matching or nearly matching lows. The same price was tested twice and buyers defended it both times.
Where it matters
Meaningful at a known support zone after a decline.
Faded candles are the trend before it, the band is the pattern, the dashed line is the level it formed at, and ✓ marks the confirming candle.
How to read it
- 01
How it forms
Candle 1 makes a new low. Candle 2 tests the same low but closes higher.
- 02
Where it matters
Meaningful at a known support zone after a decline.
- 03
What confirms it
A close above the high of the second candle.
- 04
Where the idea is wrong
A close below the matching lows.
- 05
What volume should do
Higher volume on the second, bullish candle supports the idea that buyers are defending the level.
- 06
Common mistake
Accepting lows that only roughly match. The closer the two lows, the clearer the message.
Read it next
From the book
Read the full chapter in the book.
Chapter 10 of Trading Candlestick Patterns explains the Tweezer Bottom with real Indian market charts, volume context and stop-loss placement.
 Buy on Amazon — ₹300
 Buy on Flipkart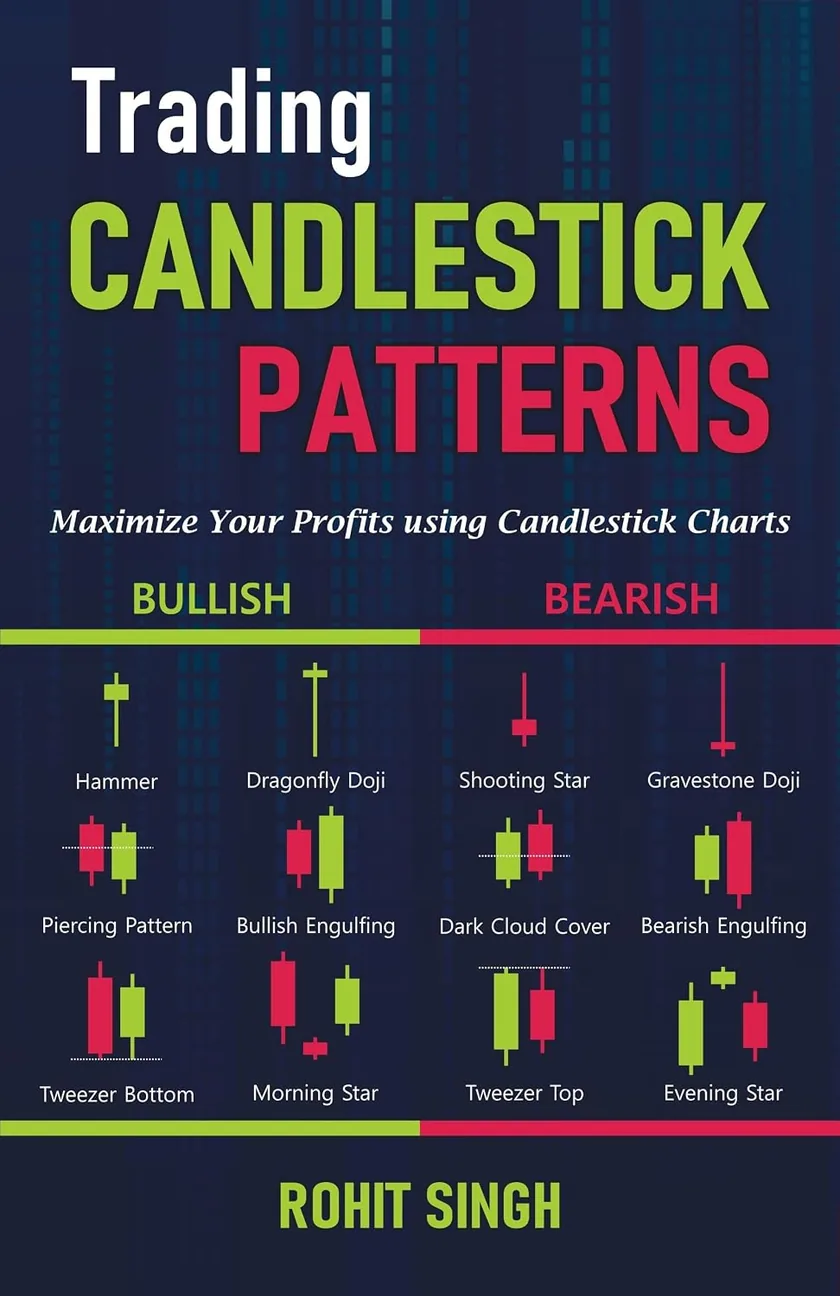
Educational content only. A pattern describes what buyers and sellers did; it does not predict what price will do next. Not investment advice or a buy, sell or hold recommendation.