Standard Doji
The open and the close are equal or nearly equal. Neither buyers nor sellers won the session — the market is undecided.
Where it matters
A Doji after a long trend, or at support or resistance, can be an early sign that the trend is tiring.
Faded candles are the trend before it, the band is the pattern, the dashed line is the level it formed at, and ✓ marks the confirming candle.
How to read it
- 01
How it forms
Price moves in both directions during the session but closes at or near the opening price.
- 02
Where it matters
A Doji after a long trend, or at support or resistance, can be an early sign that the trend is tiring.
- 03
What confirms it
A Doji is not a signal by itself. The candle that follows shows which side takes control.
- 04
Where the idea is wrong
There is no direction to invalidate yet. Its high and low become the levels to watch.
- 05
What volume should do
Usually lower volume. A Doji on unusually high volume at a turning point deserves closer attention.
- 06
Common mistake
Acting on the Doji alone instead of waiting for the next candle.
Read it next
Opposite pattern
Dragonfly Doji
Meaningful after a decline and at a support zone. Elsewhere it is simply indecision.
Single Candle
Bullish Marubozu
Most meaningful when it breaks out of a range or closes above a resistance level. Inside a choppy range it says much less.
Single Candle
Bearish Marubozu
Most meaningful when it breaks below a support level or a range. Inside a range it is often just noise.
From the book
Read the full chapter in the book.
Chapter 9 of Trading Candlestick Patterns explains the Standard Doji with real Indian market charts, volume context and stop-loss placement.
 Buy on Amazon — ₹300
 Buy on Flipkart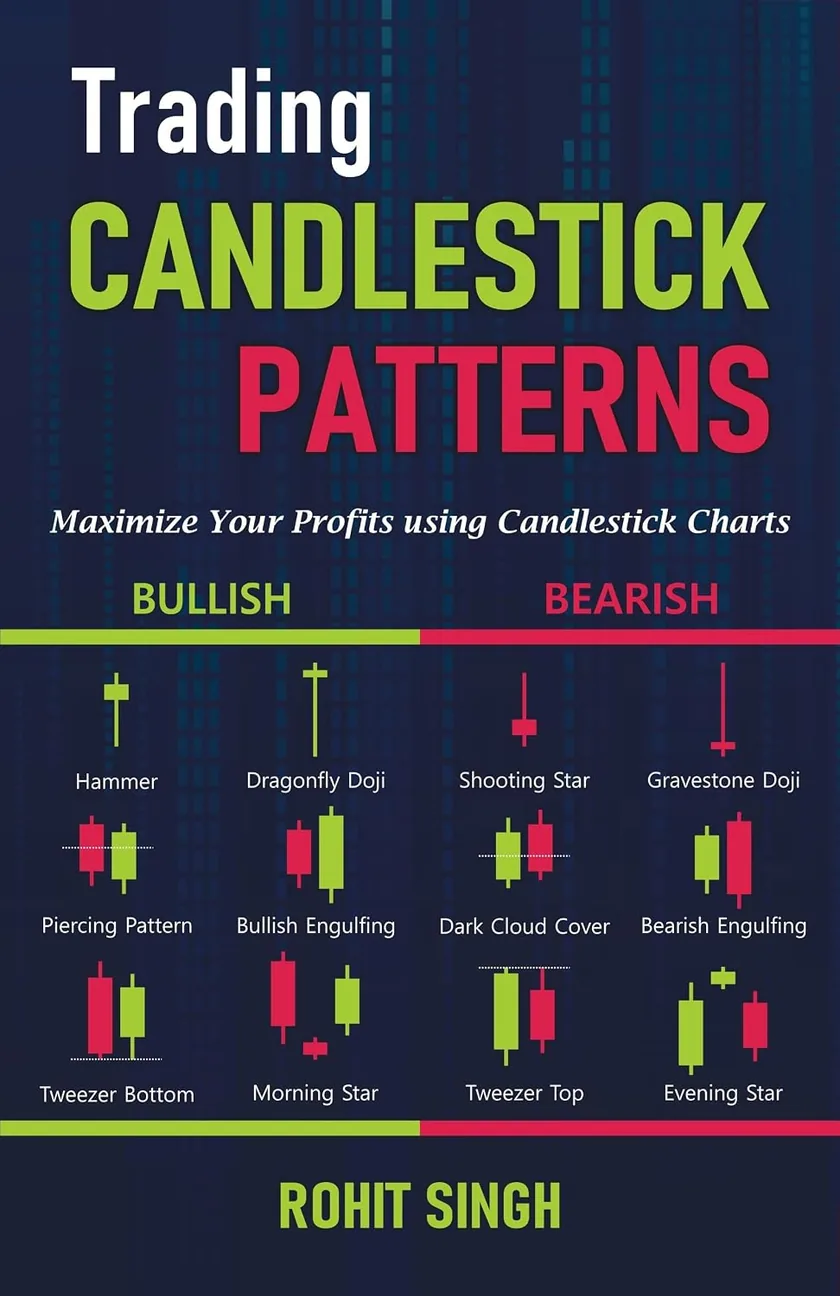
Educational content only. A pattern describes what buyers and sellers did; it does not predict what price will do next. Not investment advice or a buy, sell or hold recommendation.