Shooting Star
A small body near the bottom of the range with a long upper wick, at least twice the body. Sellers rejected the higher prices.
Where it matters
Only meaningful after a rise and at a resistance zone. In the middle of a range it carries little weight.
Faded candles are the trend before it, the band is the pattern, the dashed line is the level it formed at, and ✓ marks the confirming candle.
How to read it
- 01
How it forms
Price rallies during the session, then sellers push it back down close to the open.
- 02
Where it matters
Only meaningful after a rise and at a resistance zone. In the middle of a range it carries little weight.
- 03
What confirms it
The next candle closes below the low of the Shooting Star.
- 04
Where the idea is wrong
A close above the high of the upper wick — the level the sellers defended.
- 05
What volume should do
Higher volume on the rejection candle suggests the selling at the highs had real participation.
- 06
Common mistake
Ignoring a strong uptrend. One rejection candle rarely turns a healthy trend on its own.
Read it next
Opposite pattern
Hammer
Only a Hammer after a decline and at a support zone counts. The same shape in the middle of a range is not a Hammer.
Single Candle
Bullish Marubozu
Most meaningful when it breaks out of a range or closes above a resistance level. Inside a choppy range it says much less.
Single Candle
Bearish Marubozu
Most meaningful when it breaks below a support level or a range. Inside a range it is often just noise.
From the book
Read the full chapter in the book.
Chapter 9 of Trading Candlestick Patterns explains the Shooting Star with real Indian market charts, volume context and stop-loss placement.
 Buy on Amazon — ₹300
 Buy on Flipkart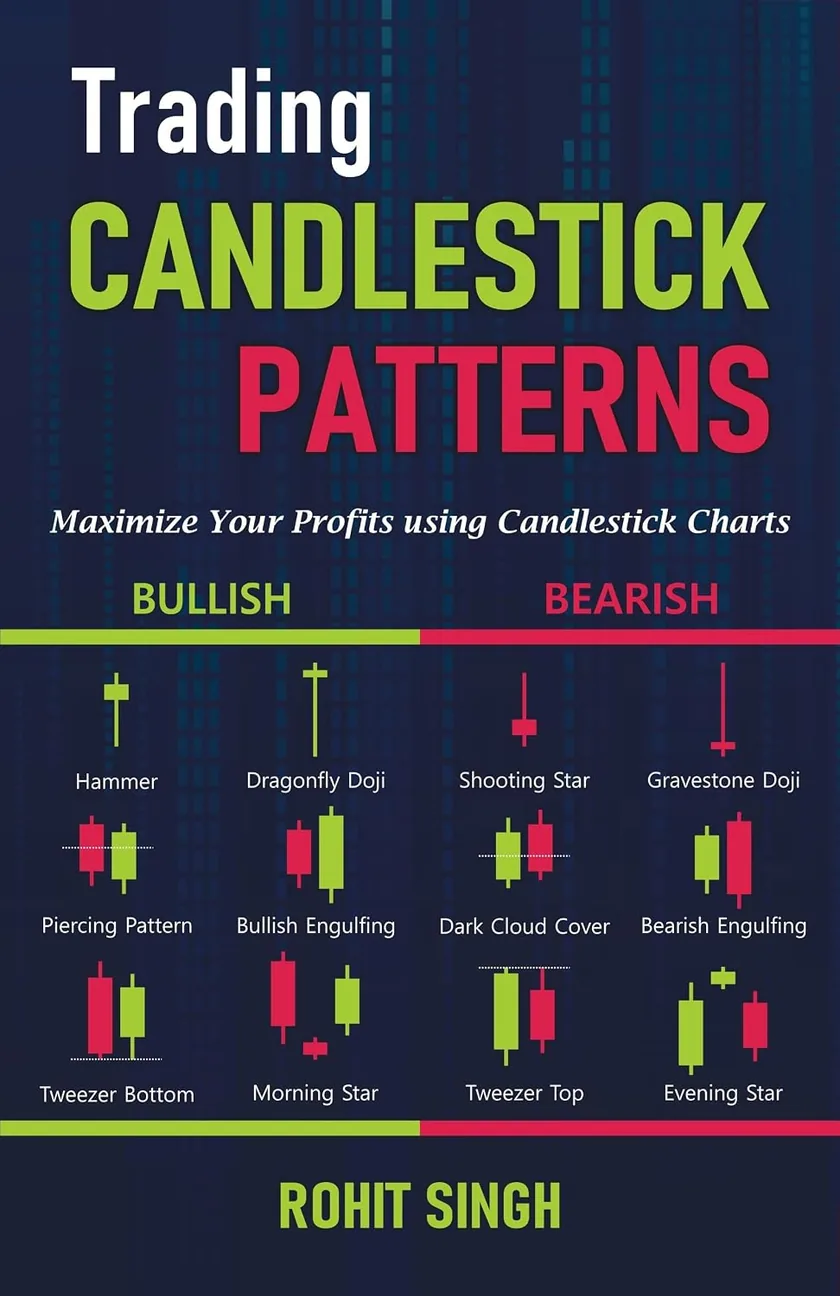
Educational content only. A pattern describes what buyers and sellers did; it does not predict what price will do next. Not investment advice or a buy, sell or hold recommendation.