Double Toppattern.
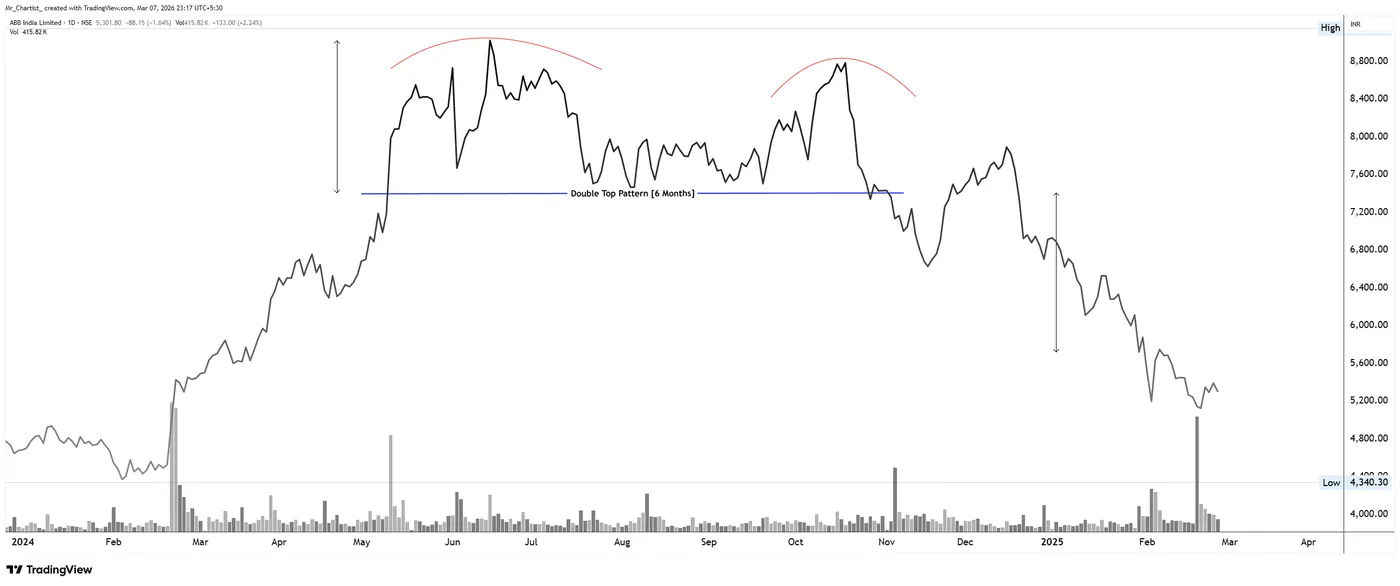
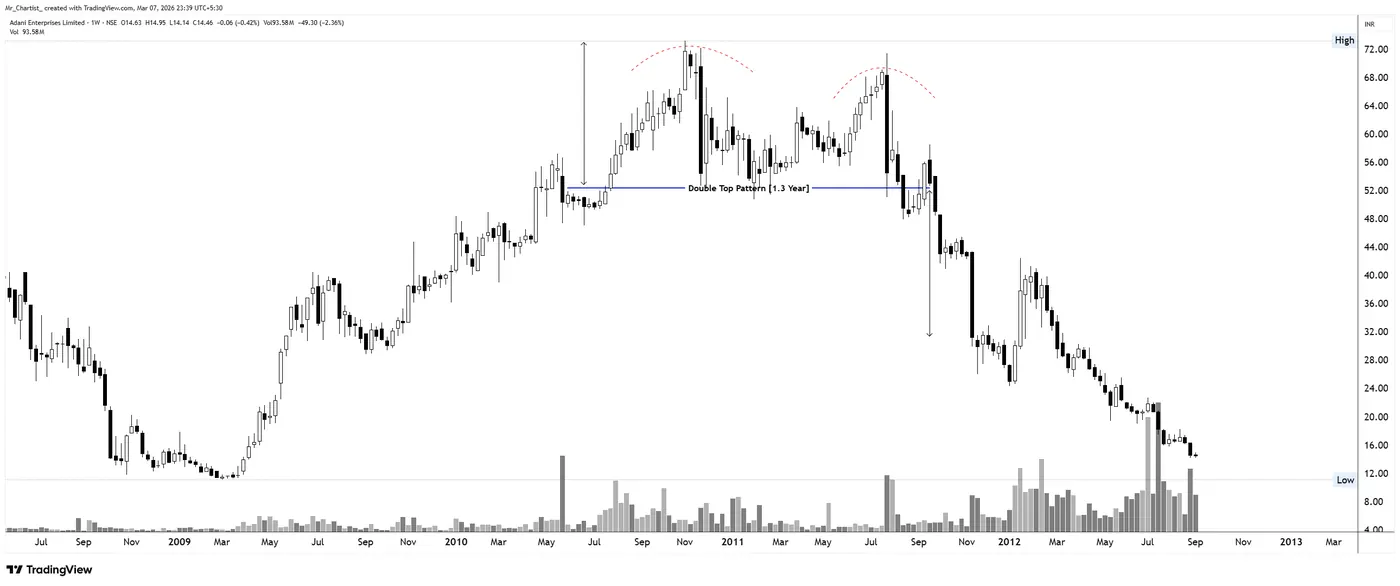
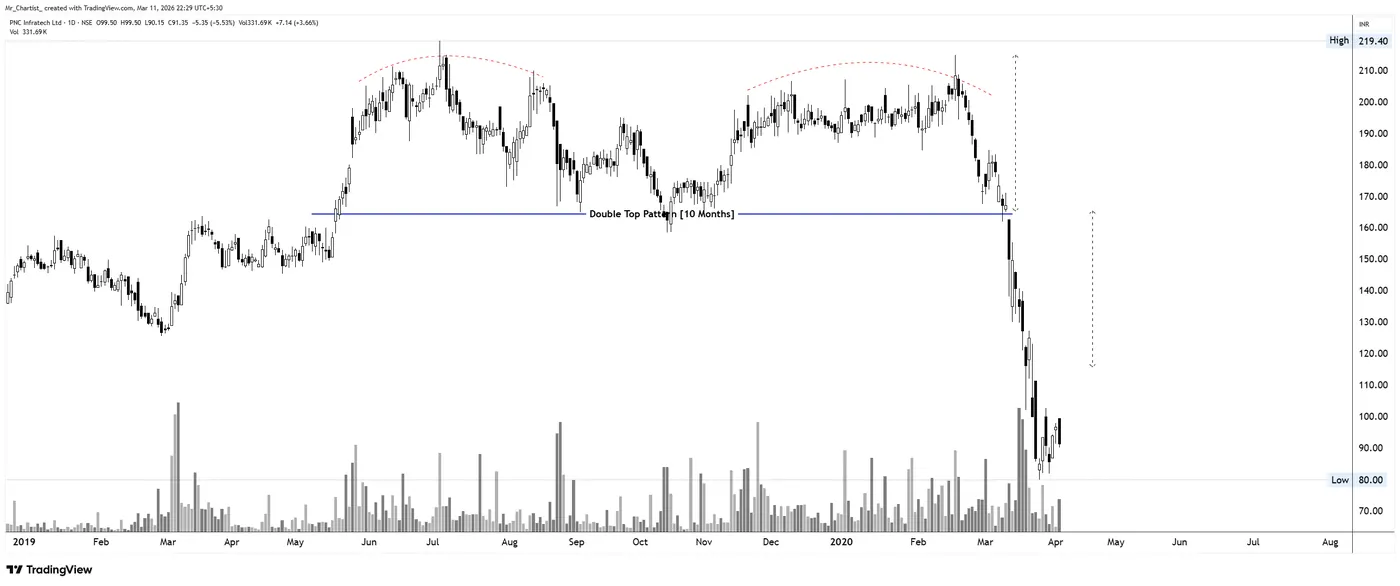
A bearish reversal structure in which price fails twice at the same horizontal resistance after an uptrend. The book reads it as resistance being defended twice, a sign of distribution rather than a simple “M” shape.
- Needs a clear uptrend before it.
- Second peak shows fading demand.
- Confirmation is a close below the neckline.
- A failed retest adds weight to the breakdown.
Idealised outline. The dashed yellow line is the support or resistance the book asks you to draw before naming the pattern.
How the book reads it
- 01
Structure — how to draw it
Mark the resistance zone where two peaks form, separated by a meaningful pullback. The low of that pullback is the neckline. The pattern is judged at this horizontal level, not at the peaks.
- 02
Psychology — who is in control
Buyers attempt to move beyond the same resistance twice and fall short. The second rally is weaker, with smaller bodies, upper wicks and lighter volume, suggesting that supply is steadily absorbing demand.
- 03
Confirmation
The book requires a decisive close below the neckline, ideally a strong bearish candle with expanding volume. A retest from below that fails to reclaim the neckline supports the reading that support has turned into resistance.
- 04
Risk — where the idea is wrong
The structure is invalidated if price recovers back into the pattern. The book places the stop around the midpoint of the pattern’s height and uses the resistance-to-neckline height as the measured-move reference.
- 05
Common trap
Two highs formed too quickly, too far apart or without a prior uptrend are often noise. Anticipating the breakdown before the neckline gives way raises the risk of a false signal.
On real charts
Annotated by Mr. Chartist for the book: the structure, the breakout, the pattern's height and the level that proves the idea wrong. Historical charts for education — not a view on any stock today.
More horizontal patterns
Fixed decision zones where repeated reactions create price memory, balance, and eventual expansion.
From the book · Horizontal support & resistance
The full Double Top chapter — in the book.
Development stages, volume behaviour, breakout quality, traps and more annotated case studies.