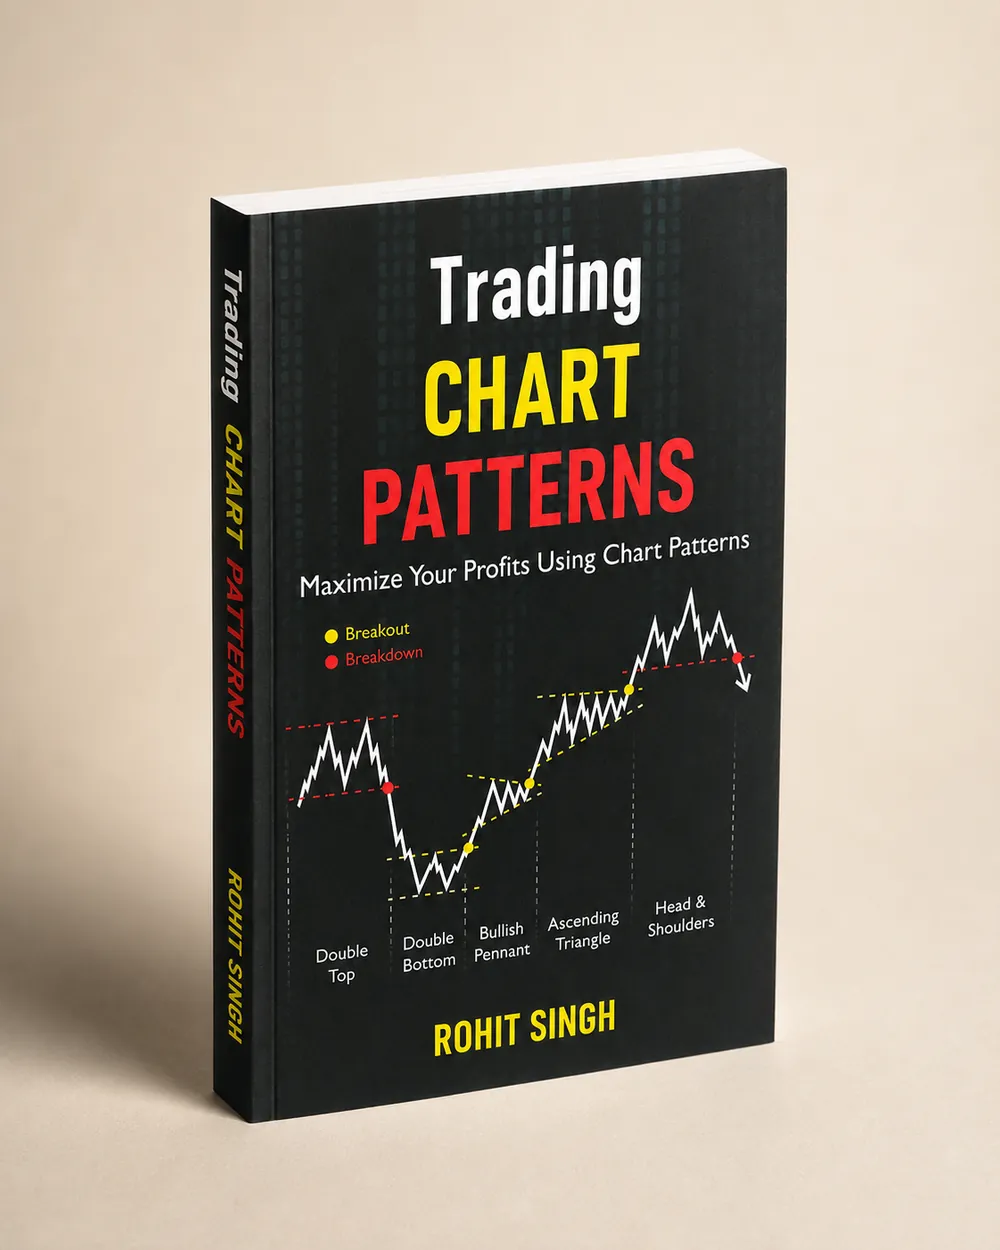
Rectanglepattern.
A balance phase in which price moves sideways between flat resistance and flat support. The book treats it as preparation, not a decision; the prior trend and context decide how it is read.
- Can act as continuation or reversal.
- Context and prior trend decide the role.
- Longer, cleaner ranges carry more weight.
- A closing breakout with volume is required.
Idealised outline. The dashed yellow line is the support or resistance the book asks you to draw before naming the pattern.
How the book reads it
- 01
Structure — how to draw it
Draw horizontal resistance and support from repeated reactions at the same zones over a good number of candles. One or two sideways swings are not enough; the book looks for consistent respect of both boundaries.
- 02
Psychology — who is in control
Buyers defend the lower zone and sellers cap the upper zone, but neither side dominates. Orders are absorbed and ownership changes hands, so the range may reflect accumulation or distribution depending on where it forms.
- 03
Confirmation
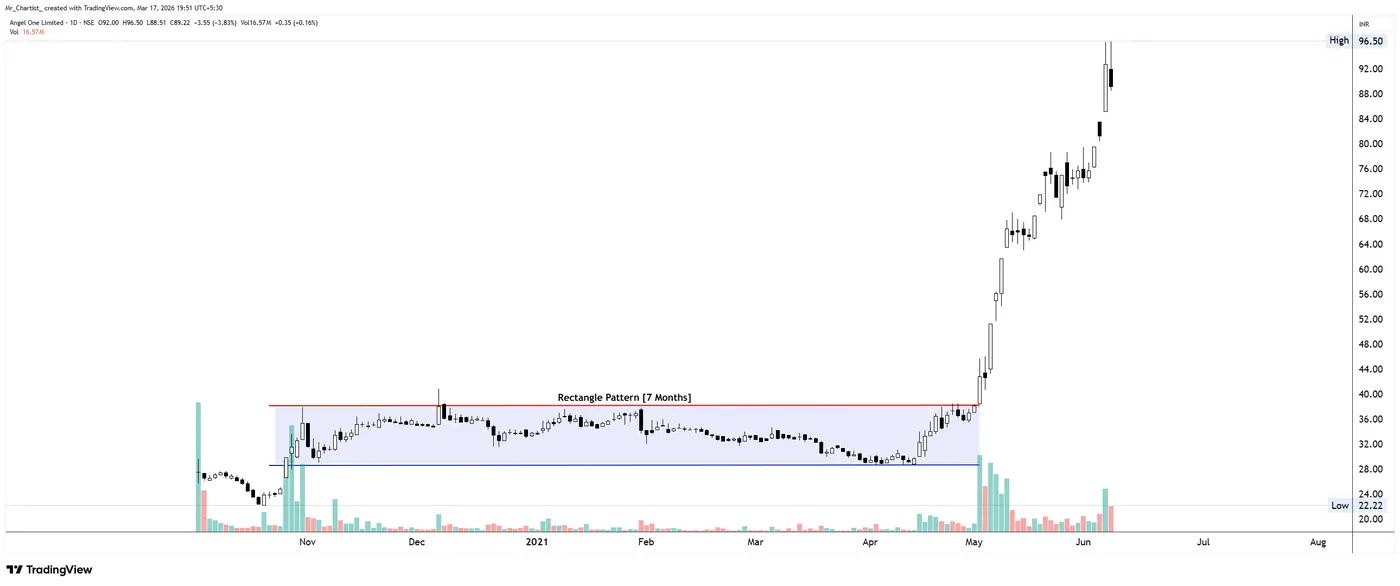
The book waits for a decisive close beyond the boundary in question, supported by visible volume expansion. A retest of the broken level that holds, with old resistance acting as support or vice versa, strengthens the reading.
- 04
Risk — where the idea is wrong
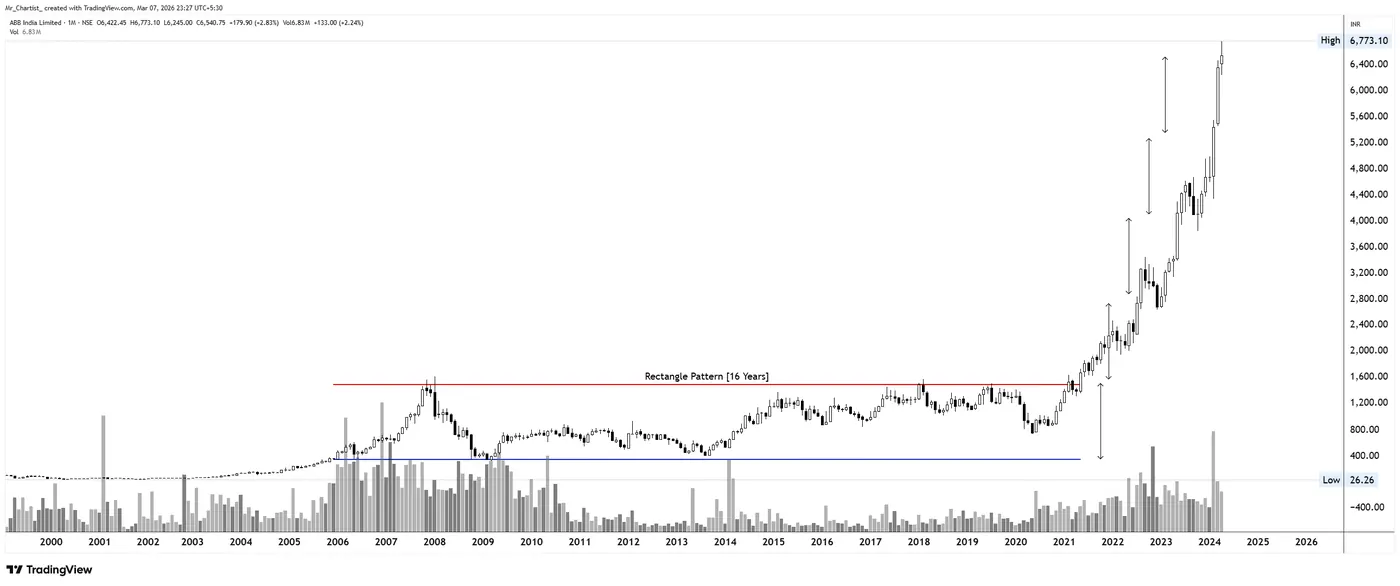
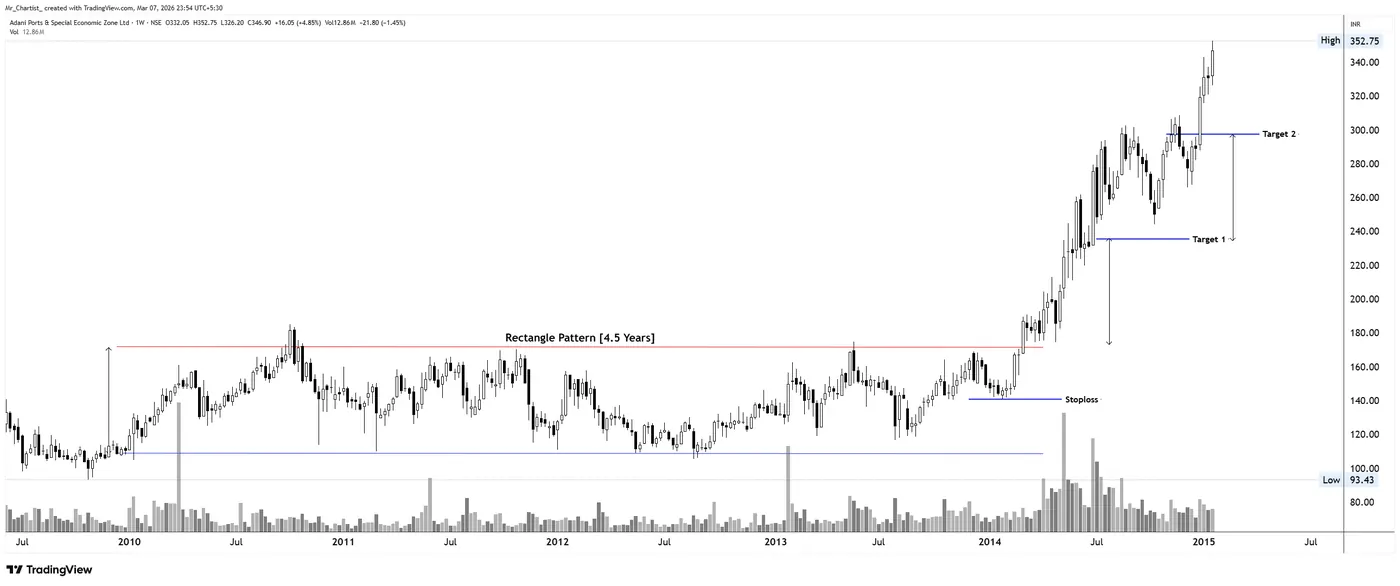
A return deep inside the range weakens the idea. The book frames the stop using roughly half the rectangle’s height from the broken level, and projects the full height from the breakout as the measured move.
- 05
Common trap
Immature, shallow ranges often lack follow-through. Wicks beyond a boundary without a close usually signal rejection, and the book cautions against assuming direction before price leaves the range with acceptance.
On real charts
Annotated by Mr. Chartist for the book: the structure, the breakout, the pattern's height and the level that proves the idea wrong. Historical charts for education — not a view on any stock today.
More horizontal patterns
Fixed decision zones where repeated reactions create price memory, balance, and eventual expansion.
From the book · Horizontal support & resistance
The full Rectangle chapter — in the book.
Development stages, volume behaviour, breakout quality, traps and more annotated case studies.