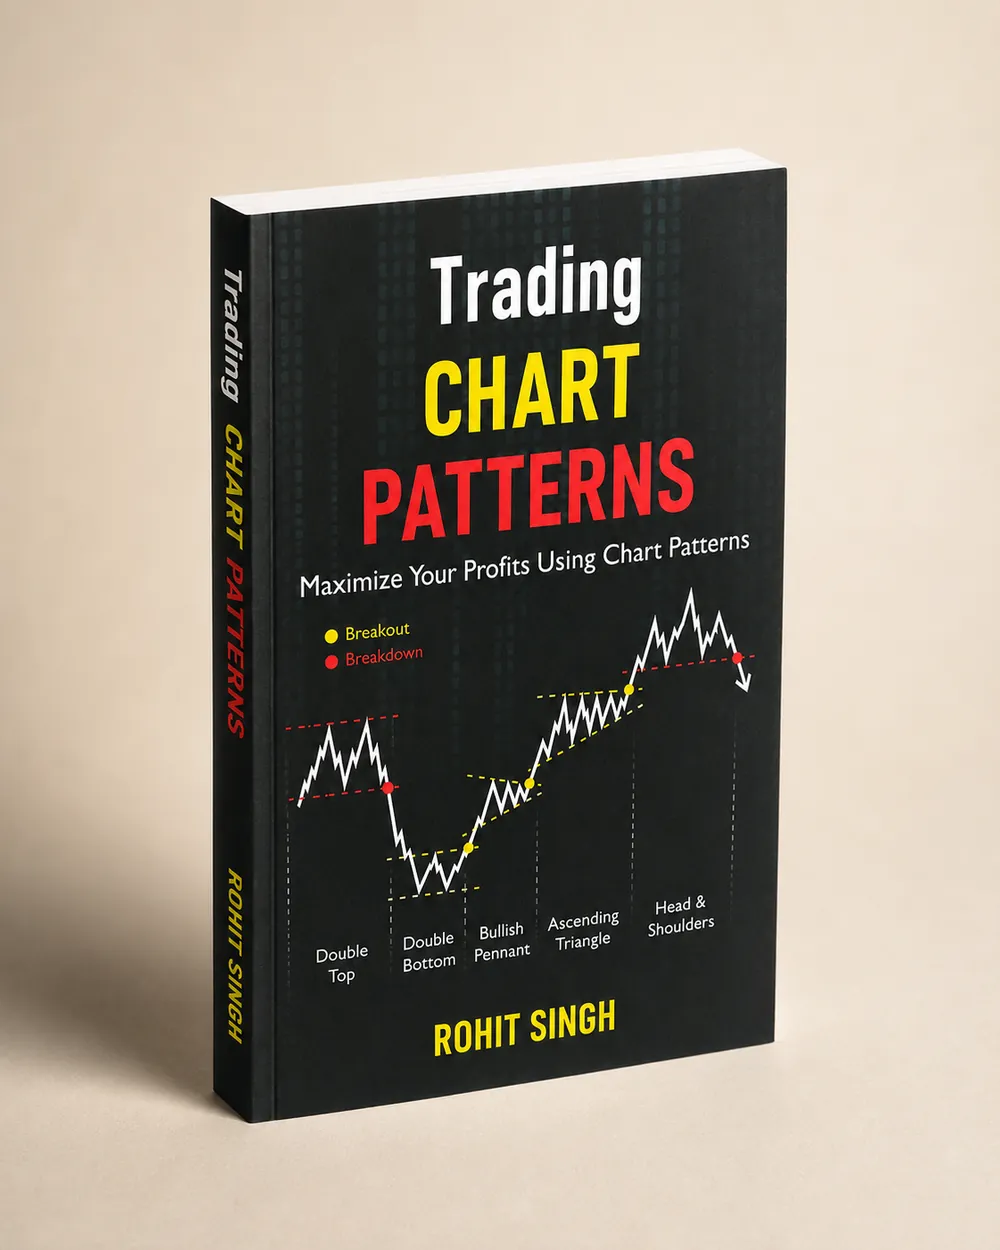
Double Bottompattern.
A bullish reversal structure in which the same horizontal support is defended twice after a downtrend. The book reads it as support holding under repeated pressure, not as a “W” shape to be spotted.
- Needs a genuine downtrend before it.
- The neckline is the decision level.
- No close above the neckline, no valid pattern.
- Volume should expand at the breakout.
Idealised outline. The dashed yellow line is the support or resistance the book asks you to draw before naming the pattern.
How the book reads it
- 01
Structure — how to draw it
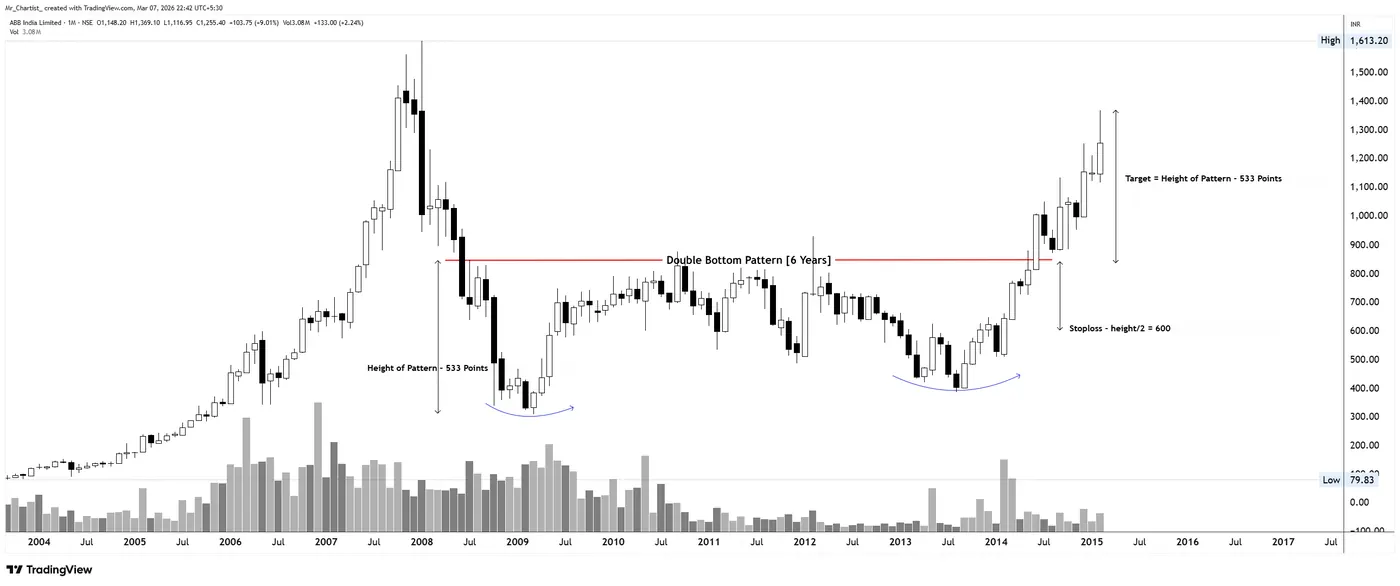
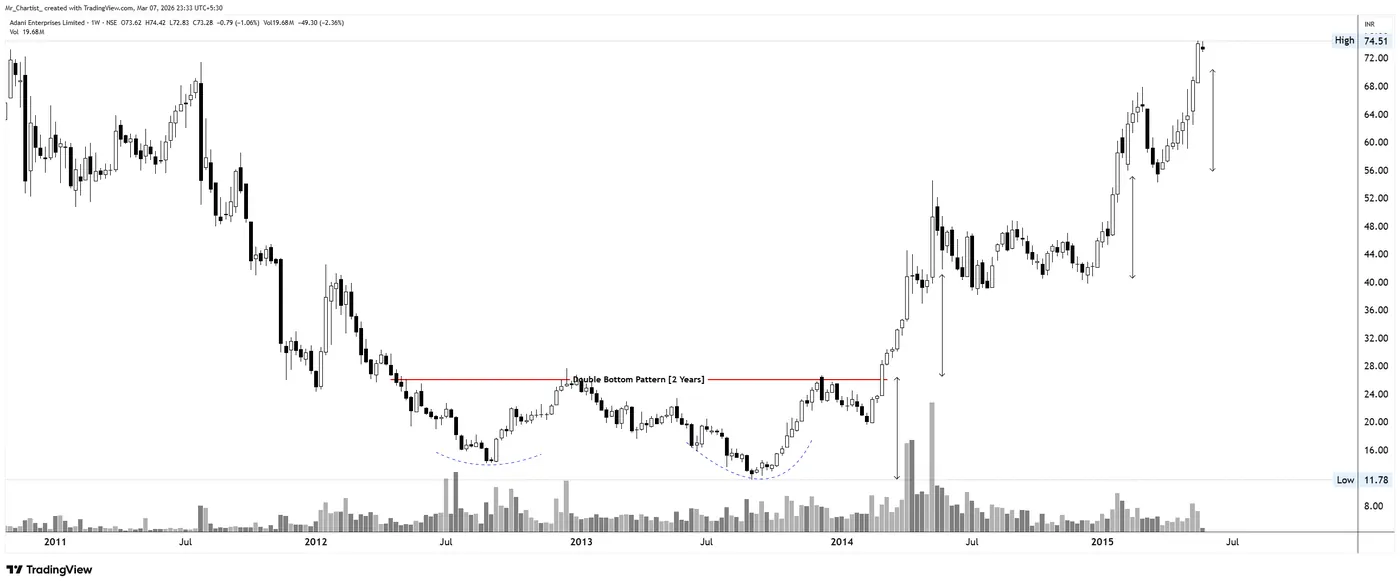
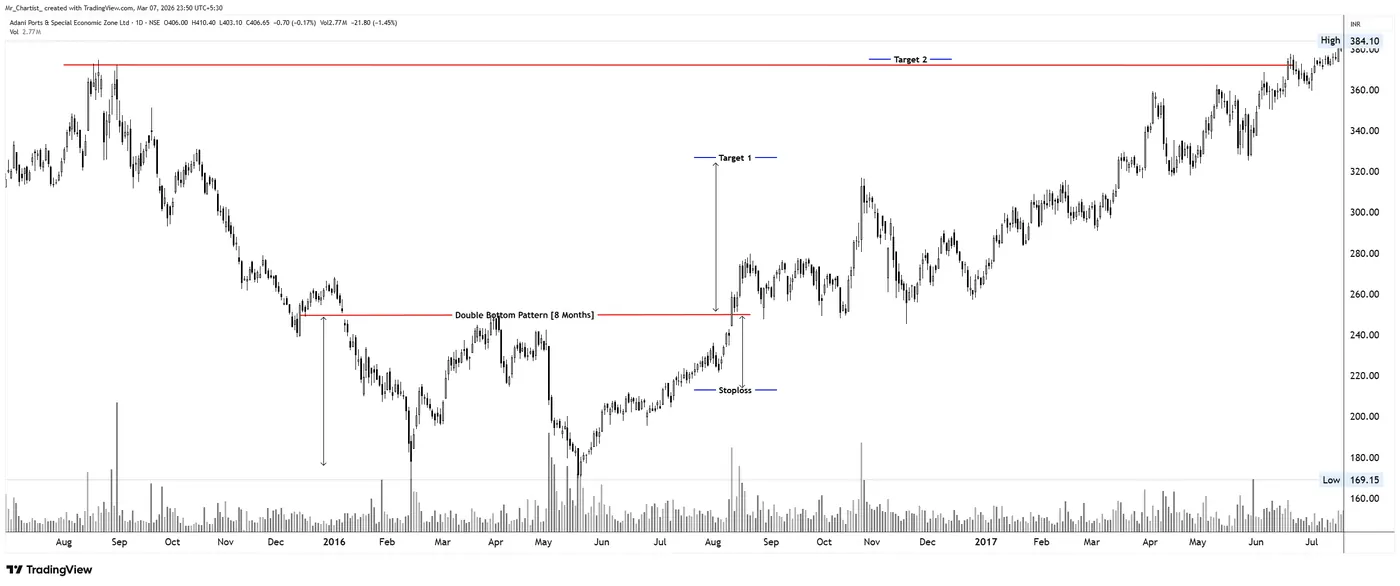
Mark the support zone where two troughs form, with enough candles between them to show a real retest. The high of the rebound between the troughs is the neckline, the horizontal level that decides the pattern.
- 02
Psychology — who is in control
Sellers try to push price below the same support twice and fail. On the second attempt the selling looks tired: smaller bodies, firmer closes and lighter volume suggest that demand is absorbing supply.
- 03
Confirmation
The book treats the pattern as complete only after a decisive close above the neckline, ideally a strong bullish candle with expanding volume. A retest of the neckline from above that holds adds further evidence.
- 04
Risk — where the idea is wrong
The idea is proved wrong when price falls back deep into the structure. The book frames the stop around the middle of the pattern’s height and uses the support-to-neckline height as the measured-move reference.
- 05
Common trap
Two random lows close together, or lows formed without a prior downtrend, do not qualify. Acting before the neckline breaks, or on a wick above it, is the common mistake the book warns against.
On real charts
Annotated by Mr. Chartist for the book: the structure, the breakout, the pattern's height and the level that proves the idea wrong. Historical charts for education — not a view on any stock today.
More horizontal patterns
Fixed decision zones where repeated reactions create price memory, balance, and eventual expansion.
From the book · Horizontal support & resistance
The full Double Bottom chapter — in the book.
Development stages, volume behaviour, breakout quality, traps and more annotated case studies.