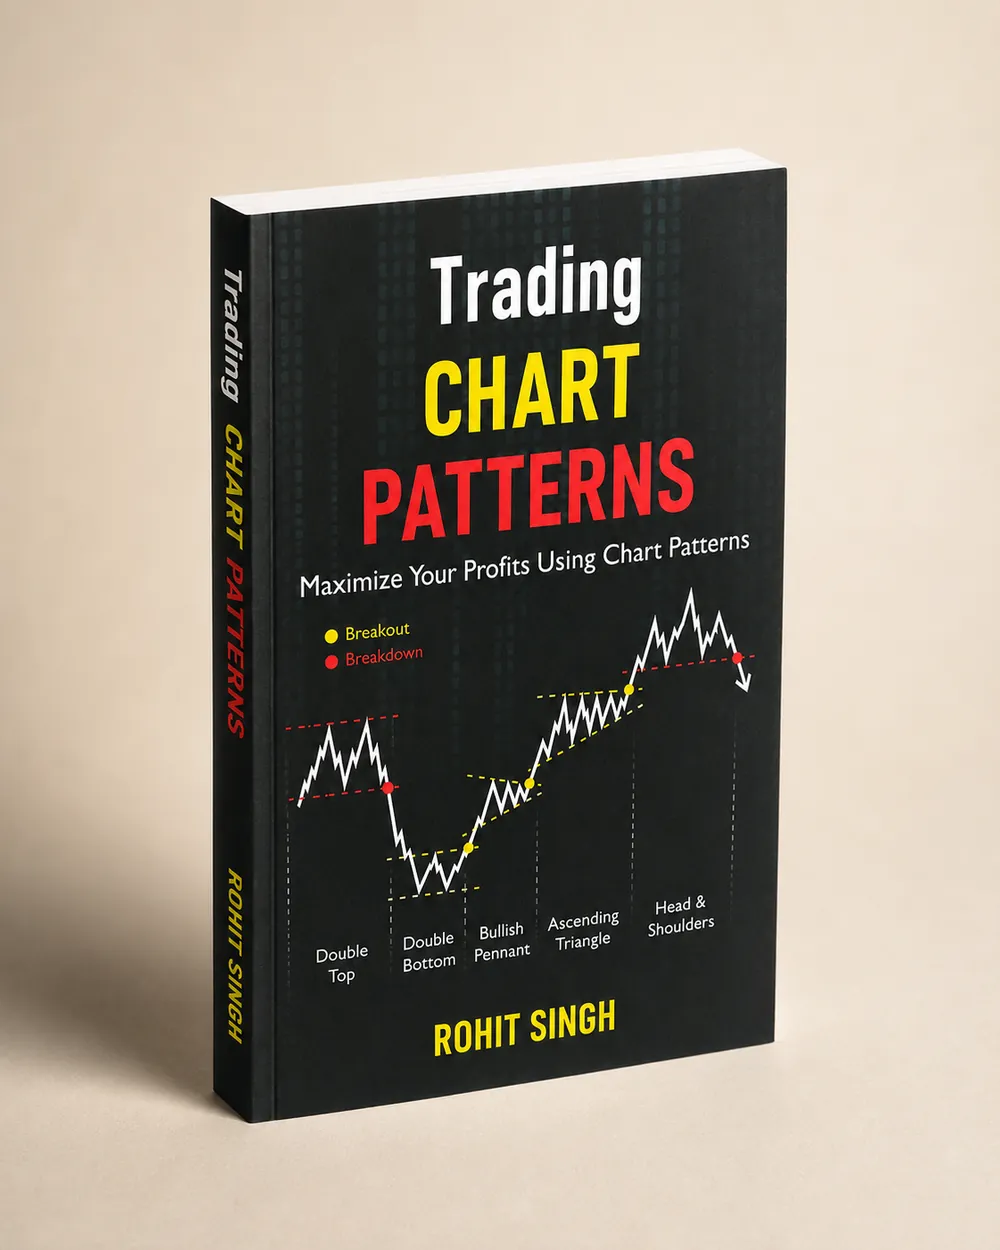
Ascending Trianglepattern.
A mixed structure that combines a flat resistance with rising support. One side defends a fixed level while the other applies steadily rising pressure.
- Flat resistance, rising support.
- Pressure builds against the defended level.
- Wait for a decisive close beyond the flat level.
- A return inside the triangle weakens the read.
Idealised outline. The dashed yellow line is the support or resistance the book asks you to draw before naming the pattern.
How the book reads it
- 01
Structure — how to draw it
Draw the horizontal resistance that sellers keep defending, then the rising support line through the higher lows. As the lows rise, the space below the flat ceiling narrows.
- 02
Psychology — who is in control
Sellers defend a fixed level while buyers step in at progressively higher prices. In the book’s framework, each reaction adds pressure against the defended level until the defending side gives way.
- 03
Confirmation
Consistent with the book’s general rule, the structure is treated as confirmed only after a decisive close beyond the horizontal level, ideally with volume expansion, rather than on a wick or intraday move.
- 04
Risk — where the idea is wrong
As with every structure in the book, the idea is proved wrong beyond the same support and resistance that formed the pattern — a return inside the triangle after the breakout weakens the read.
- 05
Common trap
The book’s general warnings apply: drawing lines to fit a hoped-for pattern, and treating a single wick above resistance as a breakout, are the usual mistakes.
On real charts
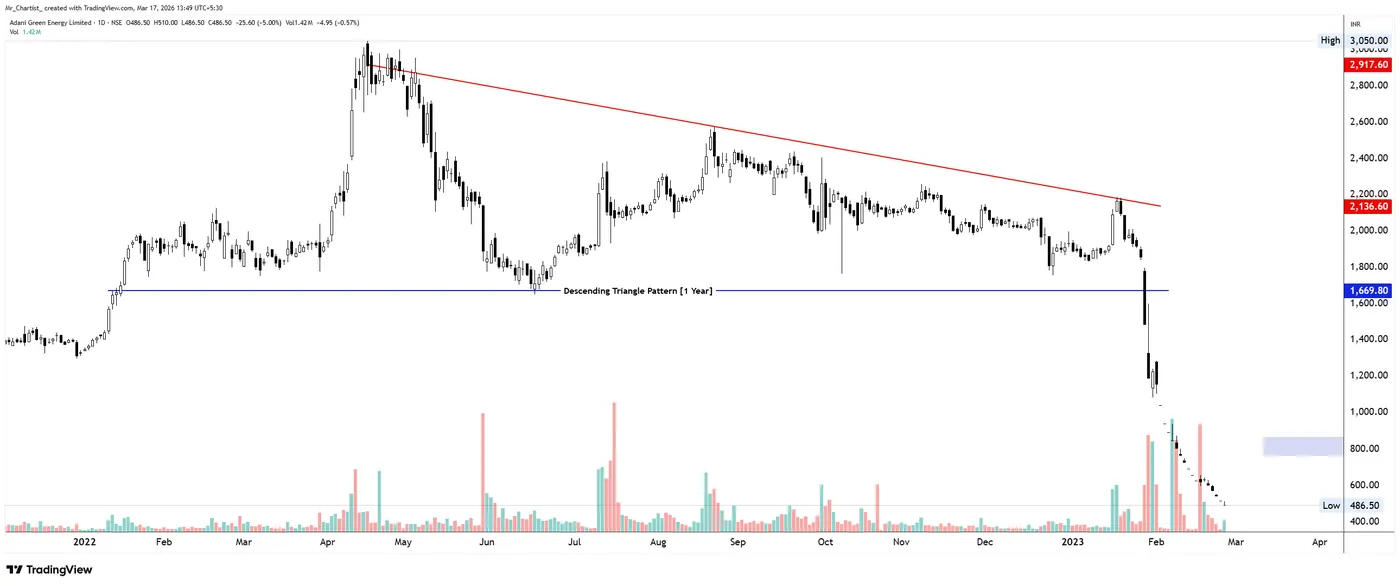
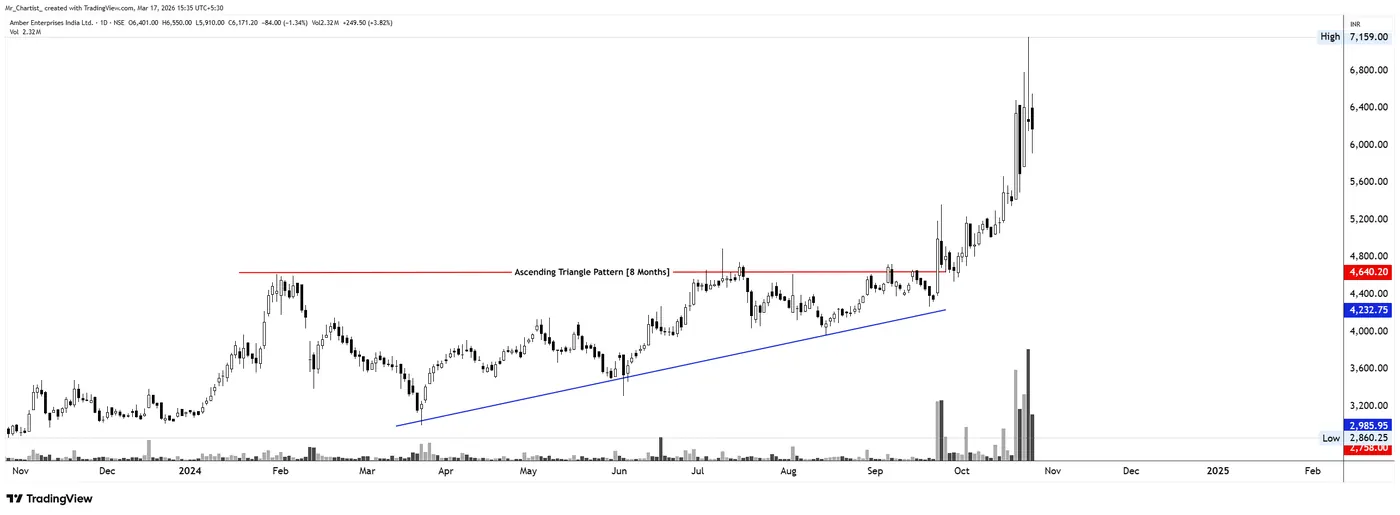
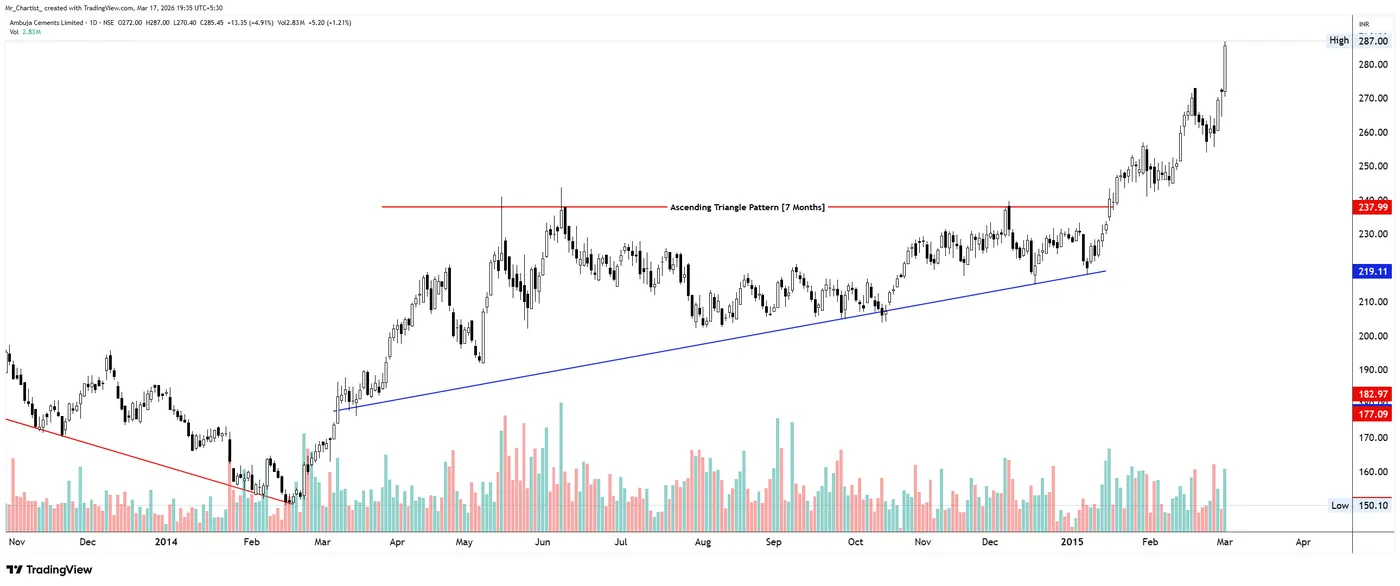
Annotated by Mr. Chartist for the book: the structure, the breakout, the pattern's height and the level that proves the idea wrong. Historical charts for education — not a view on any stock today.
More diagonal patterns
Rising or falling boundaries that reveal changing momentum, participation, pressure, and direction.
From the book · Diagonal support & resistance
The full Ascending Triangle chapter — in the book.
Development stages, volume behaviour, breakout quality, traps and more annotated case studies.