Symmetrical Trianglepattern.
A compression pattern of lower highs and higher lows between two converging trendlines. The book calls it neutral in structure: it prepares for direction rather than predicting it, and can act as continuation or reversal.
- Lower highs and higher lows converge.
- Direction is decided only by the break.
- Prior trend shapes continuation or reversal.
- Volume usually dries up inside, expands at the break.
Idealised outline. The dashed yellow line is the support or resistance the book asks you to draw before naming the pattern.
How the book reads it
- 01
Structure — how to draw it
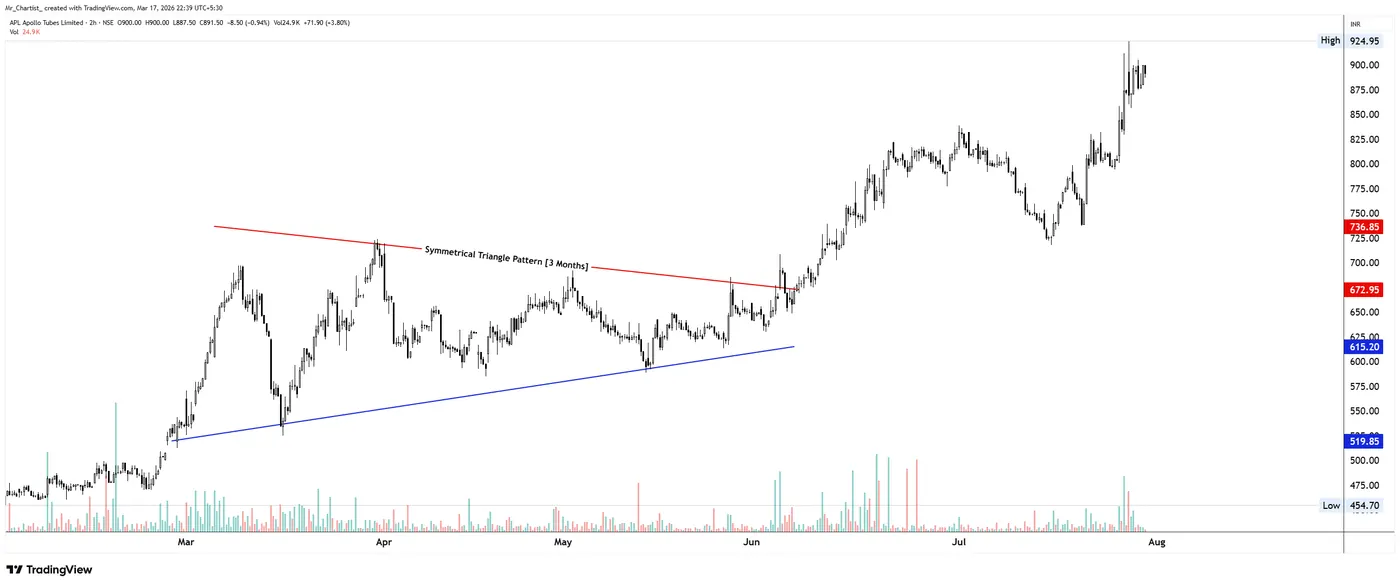
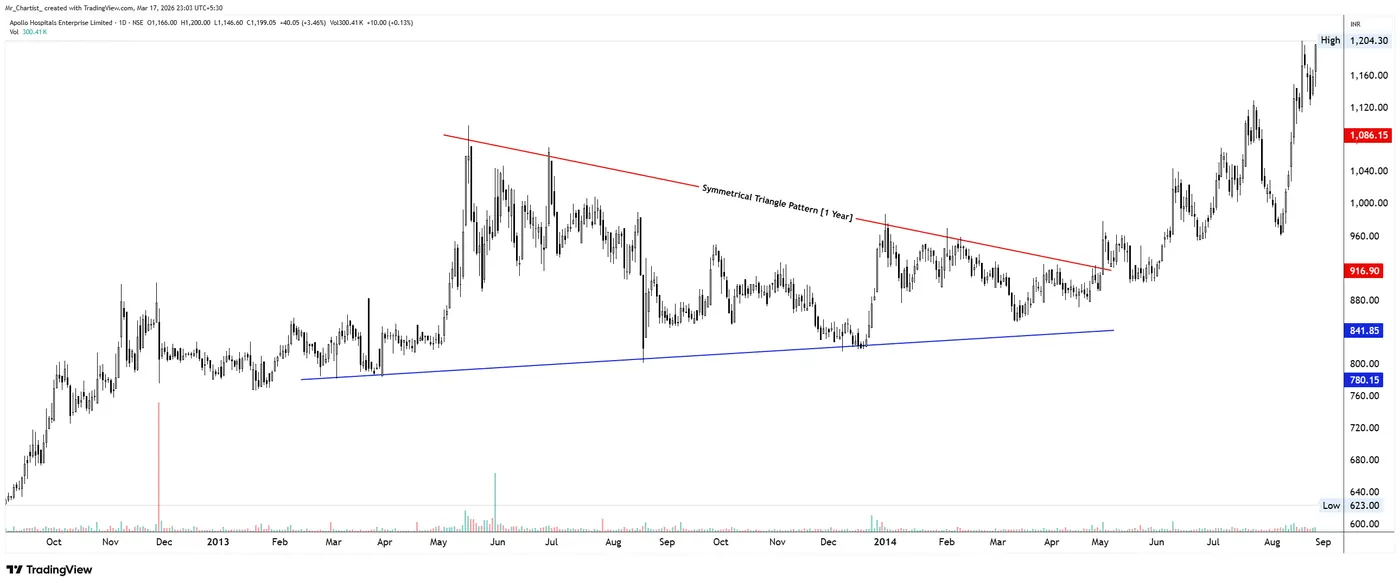
Draw a falling resistance line across the lower highs and a rising support line across the higher lows. Swings tighten, candles overlap and volatility contracts as price moves toward the apex.
- 02
Psychology — who is in control
Buyers stop chasing and sellers stop pressing, so both sides reduce commitment. The narrowing range reflects a temporary balance; whichever side regains confidence first tends to drive price out of the structure.
- 03
Confirmation
The book requires a decisive close beyond one of the trendlines, ideally with expansion in range or volume. A retest of the broken line that respects the role reversal strengthens the signal.
- 04
Risk — where the idea is wrong
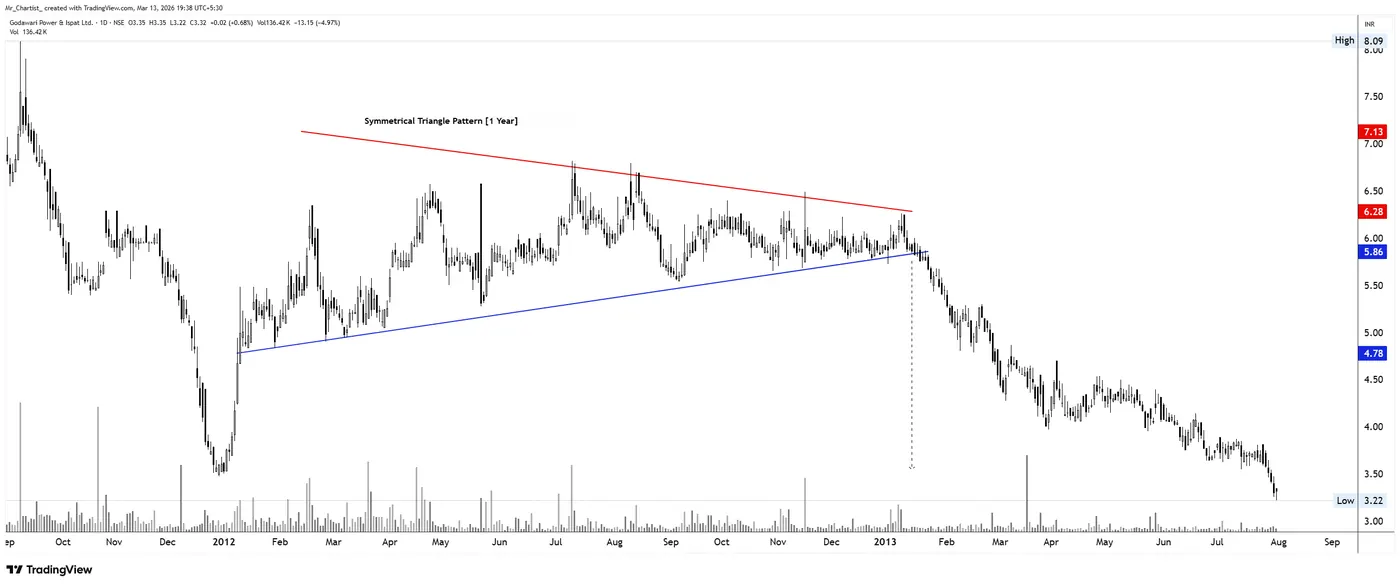
The book’s main invalidation is the last swing inside the triangle before the break, with a mid-pattern stop as an alternative when that swing is too far. The widest height of the triangle serves as the measured-move reference.
- 05
Common trap
Guessing the direction before the break is the key error. The book also stresses that textbook-perfect triangles are rare, and that a quick return inside the lines after a break is a warning.
On real charts
Annotated by Mr. Chartist for the book: the structure, the breakout, the pattern's height and the level that proves the idea wrong. Historical charts for education — not a view on any stock today.
More diagonal patterns
Rising or falling boundaries that reveal changing momentum, participation, pressure, and direction.
From the book · Diagonal support & resistance
The full Symmetrical Triangle chapter — in the book.
Development stages, volume behaviour, breakout quality, traps and more annotated case studies.