Descending Channelpattern.
An orderly decline between two parallel falling trendlines. The book reads it as controlled absorption rather than true weakness, so it can carry a bullish bias when the fall lacks expansion in momentum or participation.
- Looks bearish, often behaves as absorption.
- Declines lose momentum as the channel matures.
- Upper-line break with a decisive close confirms.
- Retest holding as support adds evidence.
Idealised outline. The dashed yellow line is the support or resistance the book asks you to draw before naming the pattern.
How the book reads it
- 01
Structure — how to draw it
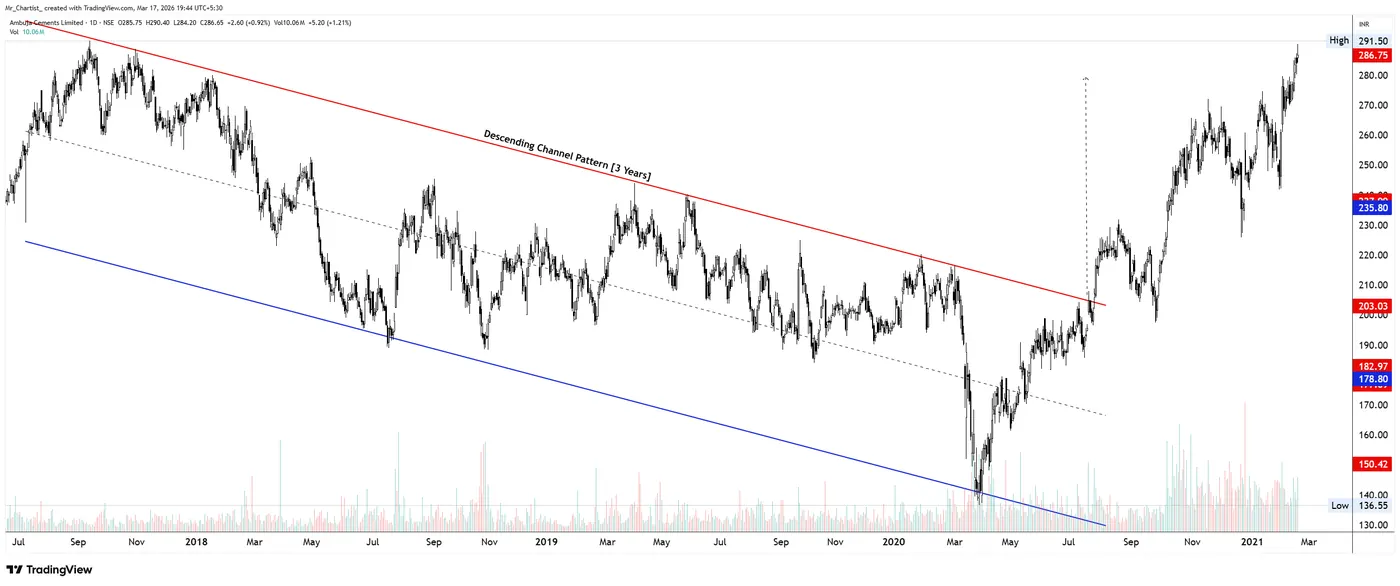
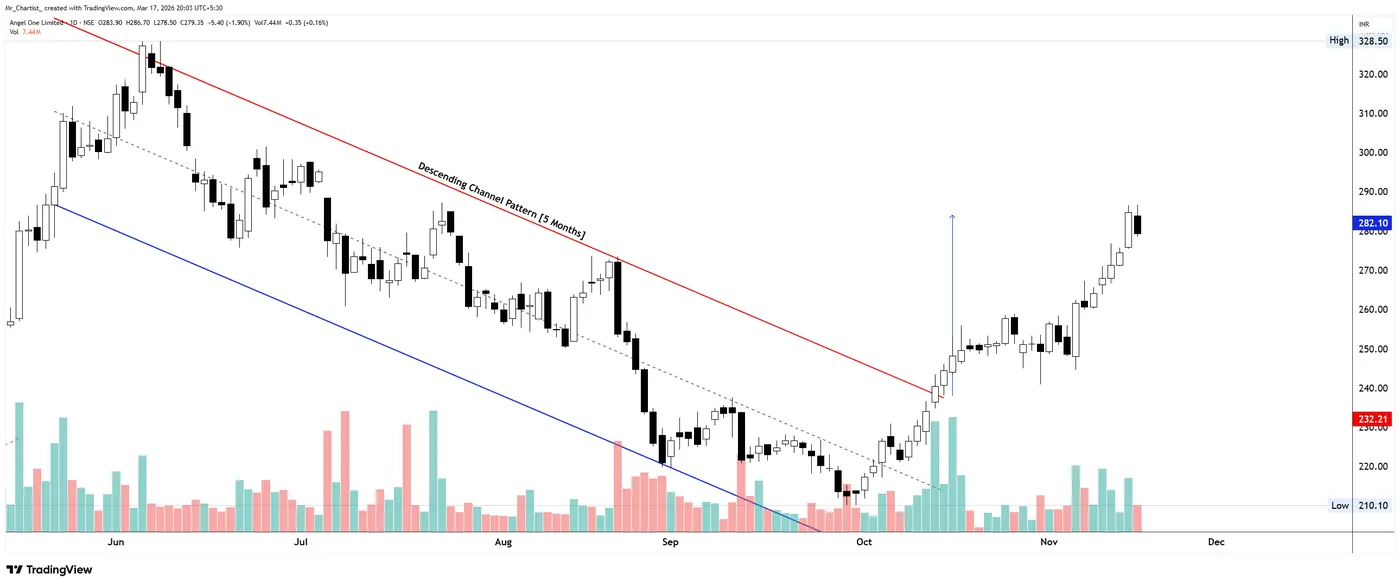
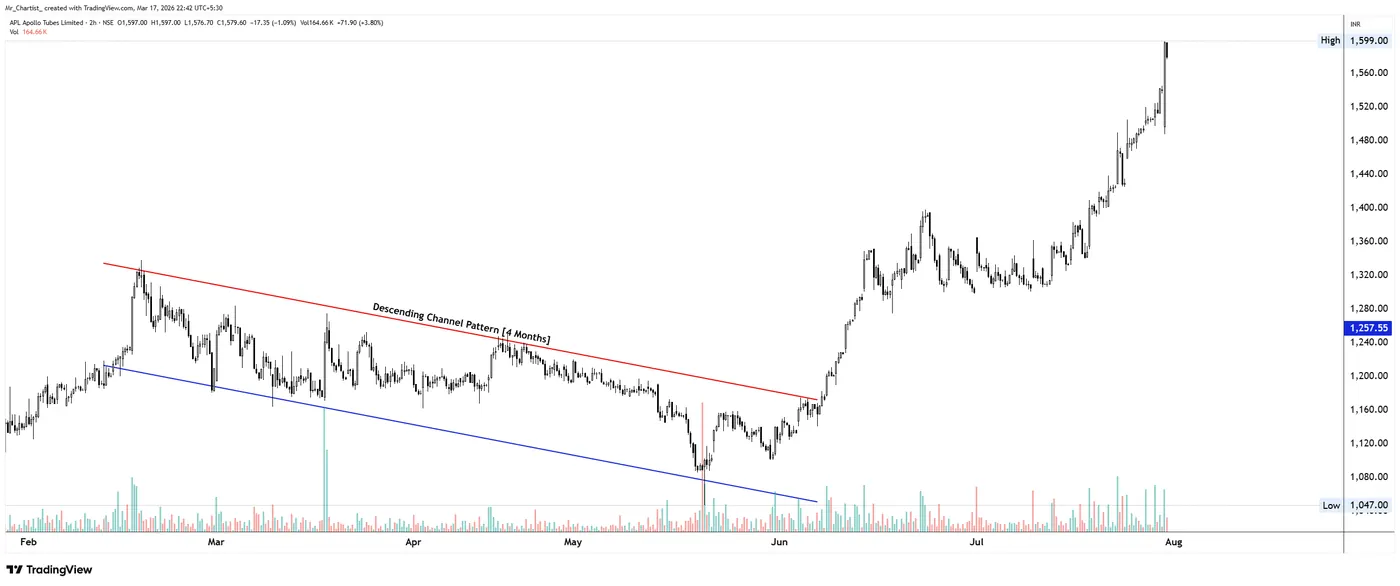
Connect the falling swing highs for resistance and the falling swing lows for support, keeping the lines parallel. Several clean touches on both boundaries, built gradually over time, give the channel its meaning.
- 02
Psychology — who is in control
Late sellers keep selling near falling resistance while earlier sellers quietly cover and patient buyers absorb supply near the lows. The decline continues because buying is measured, not because selling is growing.
- 03
Confirmation
The book looks for a decisive close above the upper channel line, ideally with a strong body and expansion in range or volume. A retest from above that holds as support adds confirmation.
- 04
Risk — where the idea is wrong
The book places invalidation below the last swing low inside the channel. A first reference is the channel’s height projected from the breakout; a second, structural reference is the zone where the decline began.
- 05
Common trap
Treating every rally as a fresh selling opportunity is the trap the book describes. Intraday spikes or partial closes above resistance, and a fall back inside the channel, mean the breakout is not confirmed.
On real charts
Annotated by Mr. Chartist for the book: the structure, the breakout, the pattern's height and the level that proves the idea wrong. Historical charts for education — not a view on any stock today.
More diagonal patterns
Rising or falling boundaries that reveal changing momentum, participation, pressure, and direction.
From the book · Diagonal support & resistance
The full Descending Channel chapter — in the book.
Development stages, volume behaviour, breakout quality, traps and more annotated case studies.