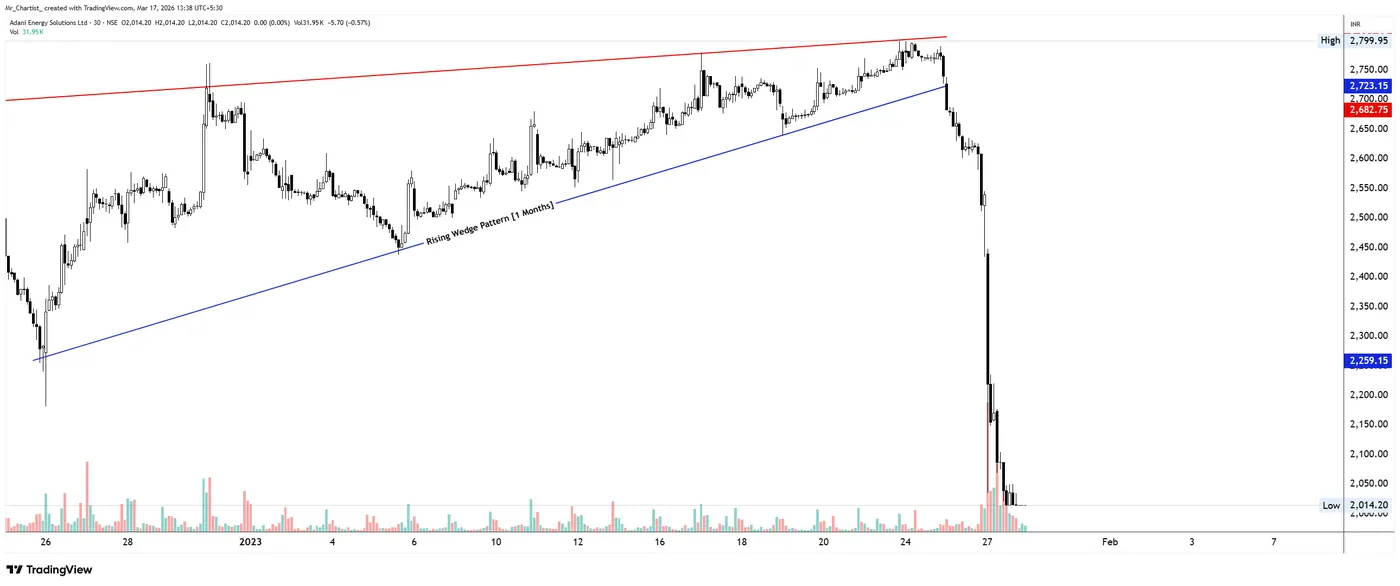
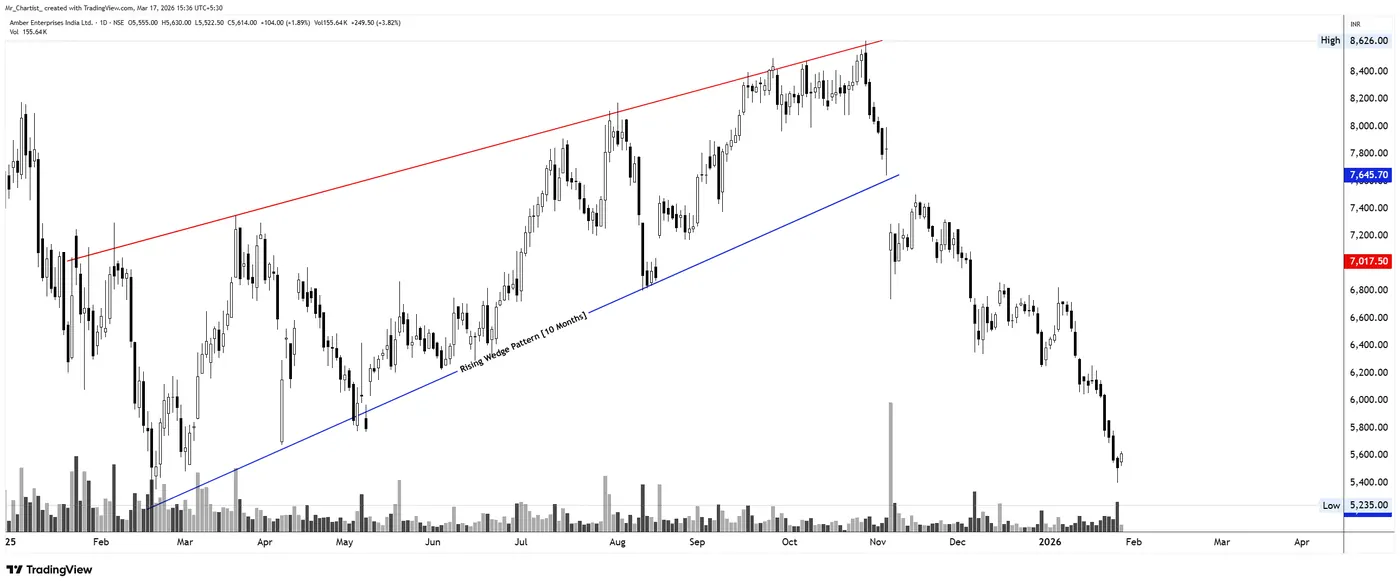
Rising Wedgepattern.
A narrowing advance between two rising trendlines that the book reads as weakening demand. It looks bullish, but its usual outcome is bearish; where it forms decides whether it is a continuation or a reversal.
- Support rises faster than resistance.
- Bearish in outcome despite the rising shape.
- Continuation in a downtrend, reversal after a long rally.
- Shrinking range signals fading momentum.
Idealised outline. The dashed yellow line is the support or resistance the book asks you to draw before naming the pattern.
How the book reads it
- 01
Structure — how to draw it
Both lines slope upward, but the support line rises faster than the resistance line, so the range narrows as price climbs. New highs become marginal and pullbacks stay shallow.
- 02
Psychology — who is in control
Buyers keep entering, sometimes out of fear of missing out, while informed sellers reduce exposure into strength. Price rises with effort rather than dominance, which suggests that demand is no longer strong enough.
- 03
Confirmation
The book requires a decisive close below the rising support line, ideally with expansion in range or volume. A failed retest of the broken line from below supports the bearish reading.
- 04
Risk — where the idea is wrong
The book places invalidation above the rising resistance line or the last swing high near the top of the wedge. The wedge’s height projected from the breakdown is the first reference.
- 05
Common trap
Mistaking rising highs for healthy strength is the core trap. The book also warns against acting before a confirmed close below support, since wedges can grind higher longer than expected.
On real charts
Annotated by Mr. Chartist for the book: the structure, the breakout, the pattern's height and the level that proves the idea wrong. Historical charts for education — not a view on any stock today.
More diagonal patterns
Rising or falling boundaries that reveal changing momentum, participation, pressure, and direction.
From the book · Diagonal support & resistance
The full Rising Wedge chapter — in the book.
Development stages, volume behaviour, breakout quality, traps and more annotated case studies.